
This article explains how to use the general functionalities of the dashboards.
Toolbar Functions
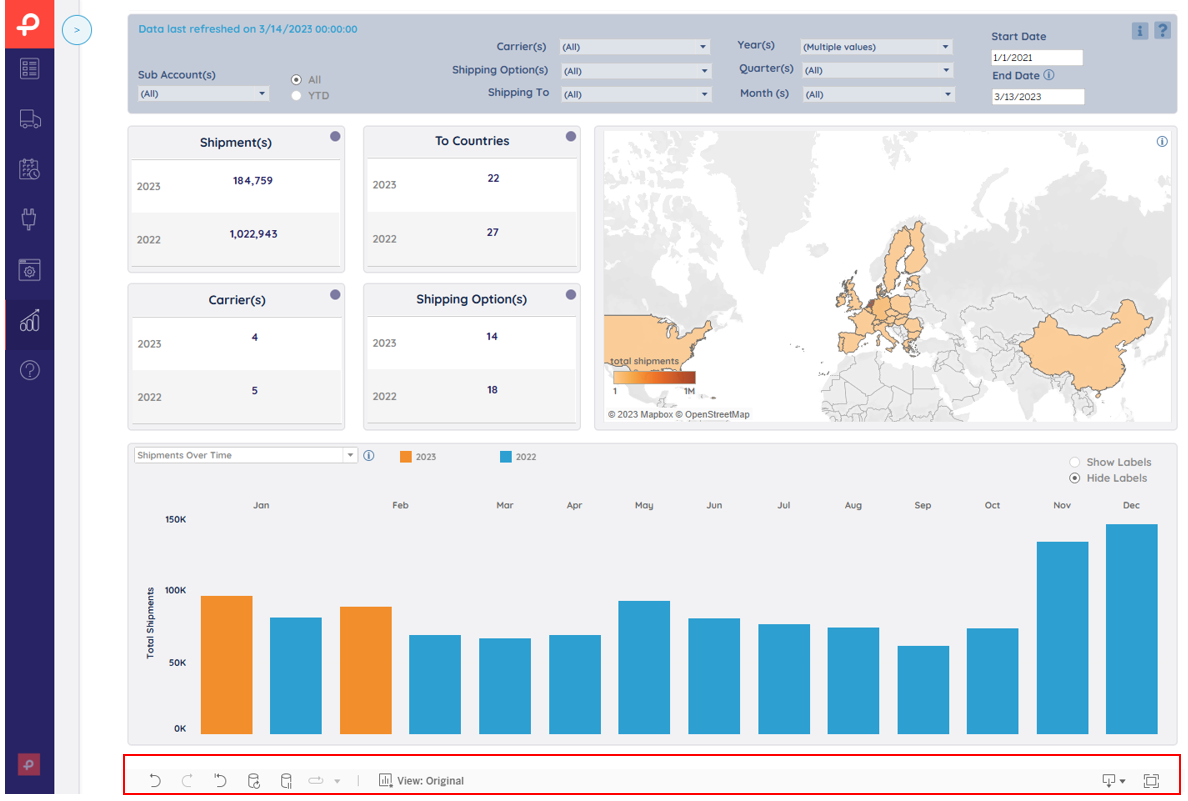
- Undo: undo my last action
- Redo: redo my last action
- Reset view: back to the starting mode
- Refresh data in this view: forces update with the latest data
- Pause: pauses data queries while applying actions
- View: create and store your own default dashboard view(s)
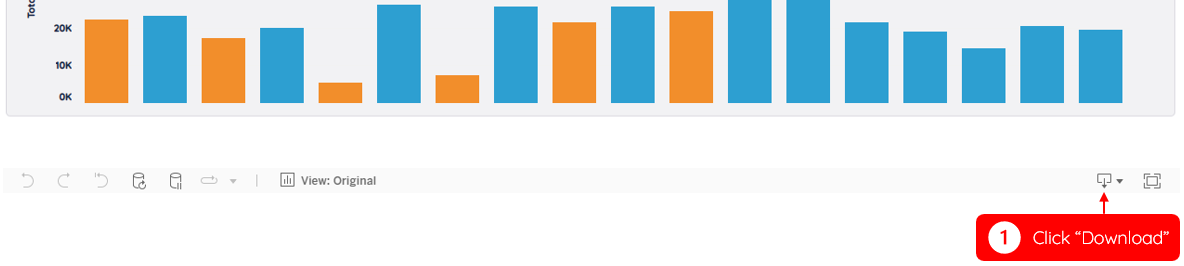
- Downloads: download charts (png/pdf) and/or summary data (Excel/CSV)
- Fullscreen: switch the dashboard view to full-screen mode
Go to the Manual & FAQ page
All the details and FAQs on how to use the dashboards can be found in the Paazl portal.
Go to the manual (information-icon) and FAQ page (question-icon) by clicking on the icons on the right top of the dashboards.

Read tips or explanations
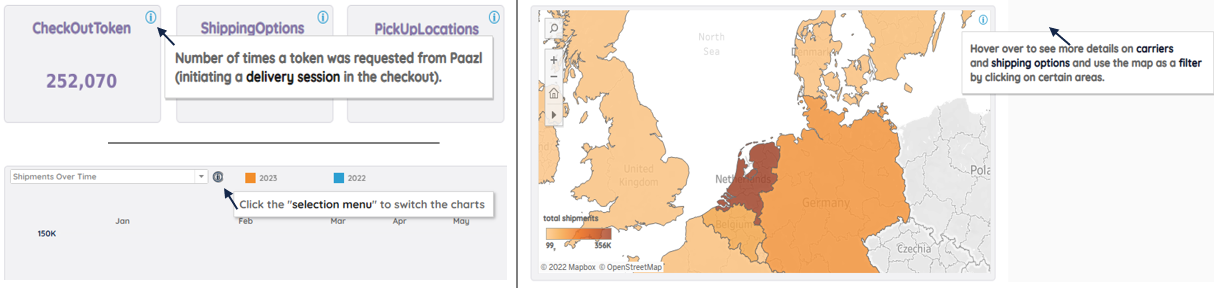
You can read tips of charts or explanations of terms by hovering over the i-icons on the right top.
Create your own dashboard templates
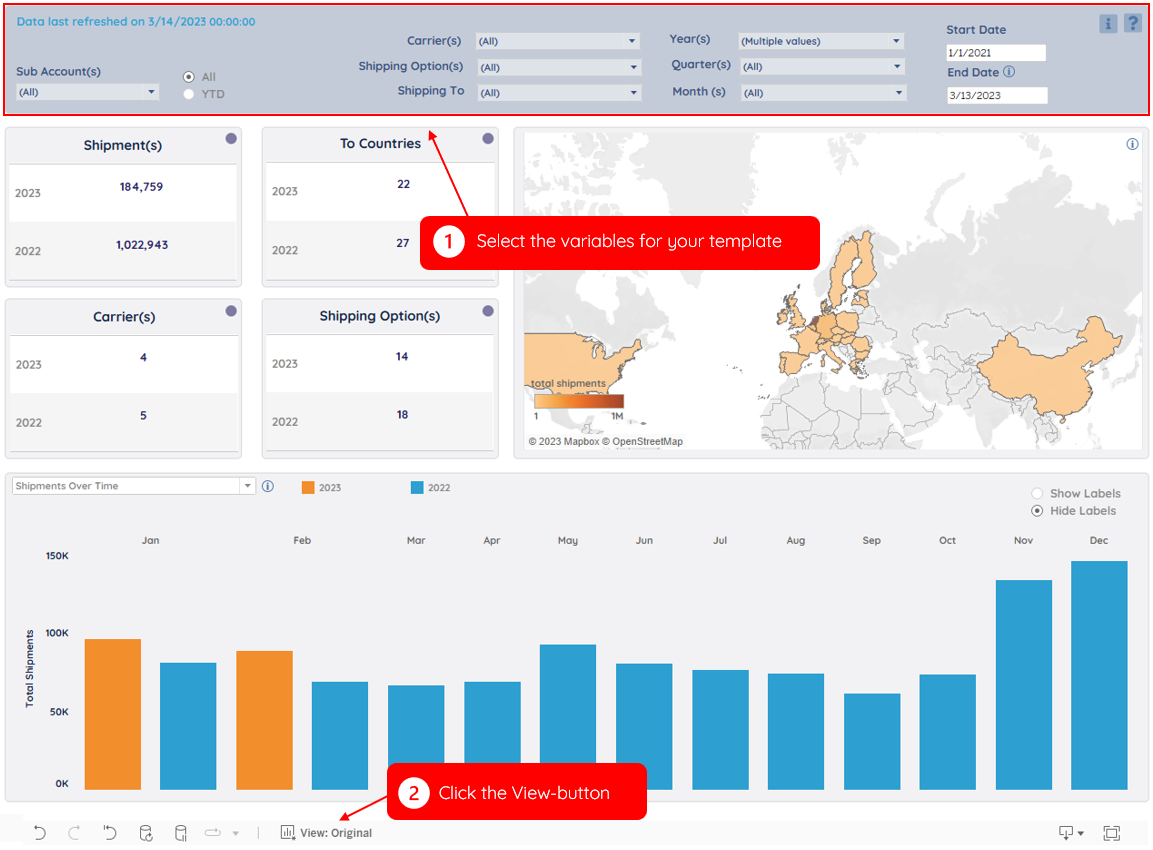
You can create your own dashboard templates by saving them as Views. You can even select one as your new default.

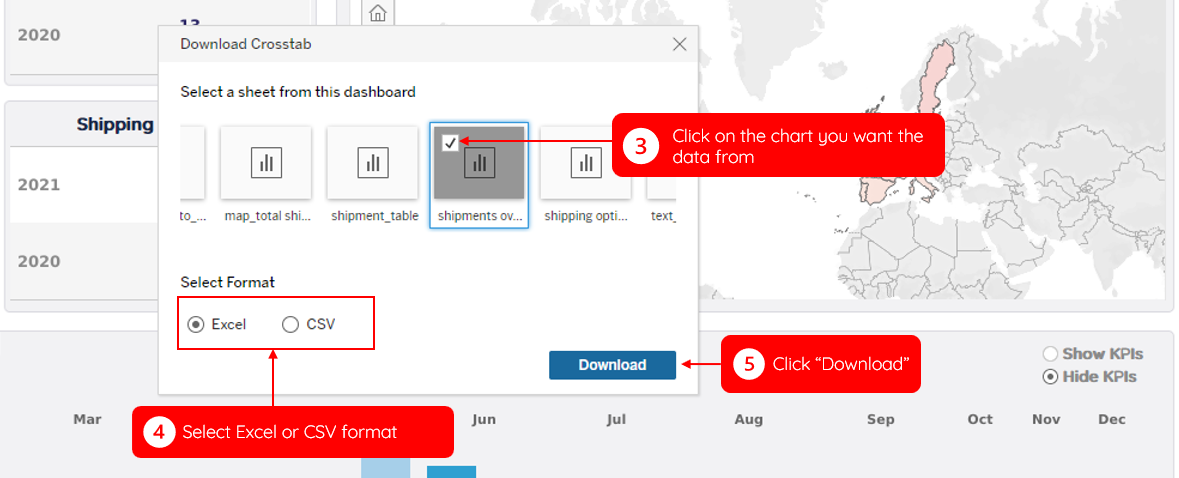
Download data using Crosstab
Use Crosstab to download the (filtered) data of a chart/table.

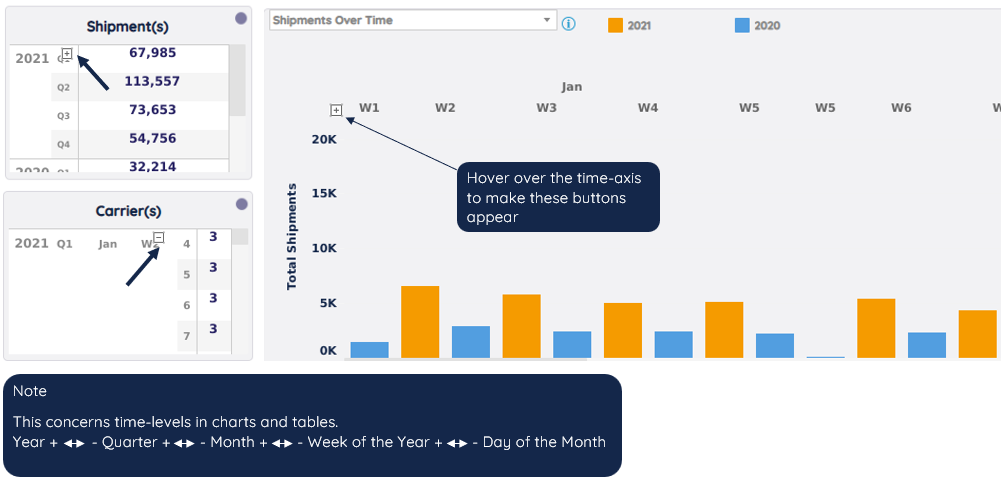
Drill down/Drill up in time
Plus/minus buttons that allow you to drill down/drill up a time level. (Year/Quarter/Month/Week/Day)
Use charts/tables/maps as filters
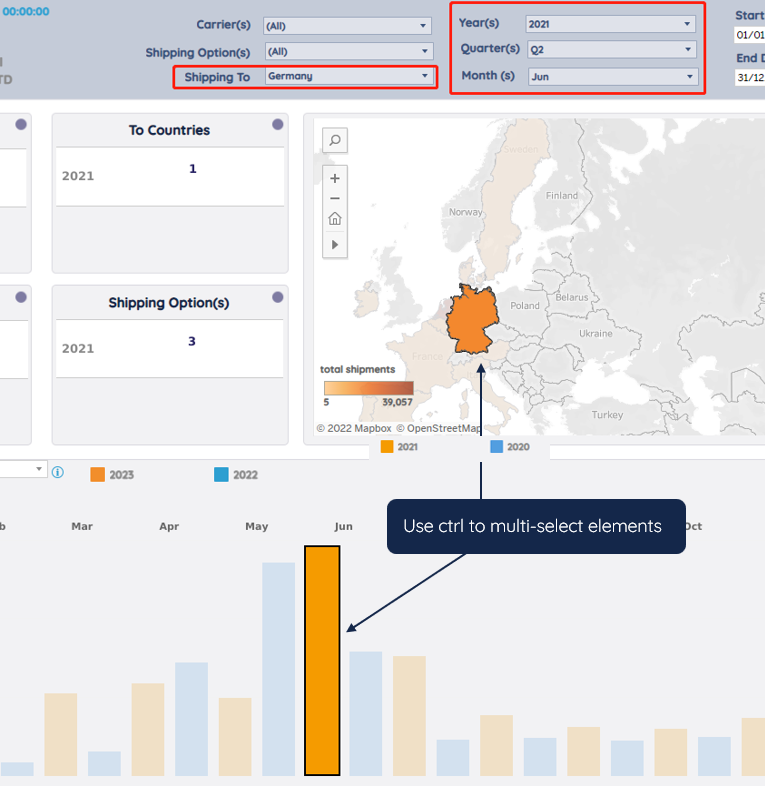
Besides the filters in the Main Menu, you can also use charts/tables/maps as filters.

Note
Unfilter by clicking on the same elements again.
Was this article helpful?
That’s Great!
Thank you for your feedback
Sorry! We couldn't be helpful
Thank you for your feedback
Feedback sent
We appreciate your effort and will try to fix the article